T2-Project Deployment
This section also describes how to build and run the T2-Projects services locally, however this is discouraged unless you want to develop.
All the deployment files mentioned below are part of the DevOps repository.
Infrastructure Provisioning
With Terraform you can easily provision the required infrastructure and dependencies of the T2-Project.
Currently, we provide configurations for three Kubernetes environments: local (kind), AWS (EKS) and Azure (AKS). The Terraform configurations are located in the directory terraform of the DevOps repository. You can find more information about how to use the provided Terraform configurations in the file README.md of the terraform directory.
Deploy on a Kubernetes Cluster
This section describes how to deploy the T2-Project on a Kubernetes cluster. All the K8s manifests are located in the devops repository in the subfolder k8s or more specifically in k8s/t2-microservices.
In the following we explain the basic deployment steps, however, there are also some slightly more sophisticated Bash scripts to make the deployment easier:
start-microservices.shstop-microservices.shupdate-microservices.sh
Note: To deploy the T2-Project to a managed Kubernetes environment like AWS Elastic Kubernetes Services (EKS), Azure Kubernetes Service (AKS), etc., some additional configuration may be required. Look into the provided Terraform configurations for more information.
Helm Charts
The T2-Project needs Kafka and MongoDB. Install them any way you want to, e.g. from helm charts:
helm repo add bitnami https://charts.bitnami.com/bitnami
helm repo update
helm install mongo-cart --set auth.enabled=false bitnami/mongodb
helm install mongo-order --set auth.enabled=false bitnami/mongodb
helm install kafka bitnami/kafka --version 18.5.0
Note: We are using the Helm chart bitnami/kafka in the already outdated version 18.5.0 to use the same Kafka version as Eventuate (Kafka version 3.2.3) to avoid backwards compatibility issues. See used Kafka server version and used Kafka client version in the Eventuate project.
Documentation of used helm charts:
Deploy the T2-Project
For the T2-Project itself get the deployments and deploy them:
git clone https://github.com/t2-project/devops.git
cd devops/k8s/t2-microservices/base
kubectl apply -k .
These commands should deploy 10 services in addition to the MongoDB, the Kafka and the Zookeeper instances.
Access the T2-Project
ui.kubectl port-forward svc/ui 8086:80
And open http://localhost:8086/ui.
uibackend:kubectl port-forward svc/uibackend 8081:80
And open localhost:8081/swagger-ui.html.
This also works for the services inventory, orchestrator, cart and creditinstitute.
kubectl port-forward svc/inventory 8082:80 &
kubectl port-forward svc/orchestrator 8085:80 &
kubectl port-forward svc/cart 8080:80 &
kubectl port-forward svc/creditinstitute 8087:80 &
Inventory : localhost:8082/swagger-ui.html
Orchestrator : localhost:8085/swagger-ui.html
Credit Institute : localhost:8087/swagger-ui.html
Now go to page Usage to figure out what you can do with the T2-Project.
Prometheus setup
The following instructions rely on the Helm charts from the Prometheus community.
# add repo for prometheus
helm repo add prometheus-community https://prometheus-community.github.io/helm-charts

# get files to customize chart values
wget https://raw.githubusercontent.com/t2-project/devops/main/prometheus/prometheus-values.yaml
wget https://raw.githubusercontent.com/t2-project/devops/main/prometheus/blackbox-exporter-values.yaml
wget https://raw.githubusercontent.com/t2-project/devops/main/prometheus/prometheus-adapter-values.yaml

# install charts
helm install prometheus prometheus-community/kube-prometheus-stack -f ./prometheus-values.yaml
helm install blackbox-exporter prometheus-community/prometheus-blackbox-exporter -f ./blackbox-exporter-values.yaml

# optional if you want to use HPA
helm install prometheus-adapter prometheus-community/prometheus-adapter -f ./prometheus-adapter-values.yaml
Autoscaling setup
Metrics Server setup
There are two ways to install the metrics server:
Install the Helm Chart
Install manually
If you use Minikube, there is a third way to install the metrics server:
minikube addons enable metrics-server
Should you encounter an error with your metrics server, this article might be helpful.
The metrics server is running as intended when the command
kubectl top pod
does not throw an error.
If you are on Minikube and still encounter an error, there is one more known troubleshooting solution:
minikube stop
minikube start --extra-config=kubelet.housekeeping-interval=10s
If your metrics server still won’t work, good luck fixing it.
Creating the autoscaling behavior
Afterwards, navigate to the k8s/t2-microservices/autoscaling directory in the DevOps repo and create all resources inside:
kubectl apply -k .
Modifying the autoscaling behavior
If you want to modify the autoscaling behavior, i.e. by increasing the maximum replicas, add the change in the corresponding hpa_$SERVICE.yaml file there, and apply it by calling
kubectl delete horizontalpodautoscalers.autoscaling $SERVICE
kubectl apply -k .
Intensive computation simulation
Install the computation-simulator and change the config of the uibackend service:
kubectl apply -k computation-simulation/
Uninstall:
kubectl delete -f computation-simulation/computation-simulator.yaml
kubectl apply -k base/
Run with Docker
You can run the T2-Project as Docker containers.
git clone https://github.com/t2-project/devops.git
cd devops/docker
docker compose up -d
These commands should deploy 13 services in total.
UIBackend : localhost:8081/swagger-ui.html
Inventory : localhost:8082/swagger-ui.html
Orchestrator : localhost:8085/swagger-ui.html
Credit Institute : localhost:8087/swagger-ui.html
Now go to page Usage to figure out what you can do with the T2-Project.
Build and Run Locally
build-microservices.sh provided in the devops repository.Step 0 : Clone Repositories
git clone --recurse-submodules -j8 https://github.com/t2-project/t2-project.git
# Or if an SSH key has been registered with GitHub:
git clone --recurse-submodules -j8 git@github.com:t2-project/t2-project.git
Step 1 : Versions and Environment Variables
The microservices are build with a Maven multi-module setup.
See the pom.xml inside the microservices repository for the declaration of all dependencies and versions.
Step 2 : Set Application properties
Set the application properties.
They are located at ./src/main/resources/
You want to consult the service’s README on the meaning of the properties.
Step 3 : Build and Run
To build all services at once, run the following command:
./mvnw clean install
Or specify the services you want to build:
./mvnw --projects order,payment,inventory --also-make clean install
If you want to skip unit tests, you can use the argument -DskipTests=true.
Note: The Maven command install is required instead of package because of how the build for e2e-tests work.
To build and run only one service (e.g. the order service) you can use the following command:
cd order/
./mvnw spring-boot:run
Or like this, in case you want to supply specific application properties (remember to use the path to your properties file):
cd order/
./mvnw clean install
java -jar -Dspring.config.location=./src/main/resources/application.local.properties ./target/order-0.0.1-SNAPSHOT.jar
Of course, you can also use own profiles like e.g. local (./src/main/resources/application-local.yml is used automatically, if created):
cd order/
./mvnw clean install
java -jar -Dspring.profiles.active=local ./target/order-0.0.1-SNAPSHOT.jar
Step 5 : Build Docker Image
Each service repository contains a Dockerfile to build an image of that service.
Run with Test Service
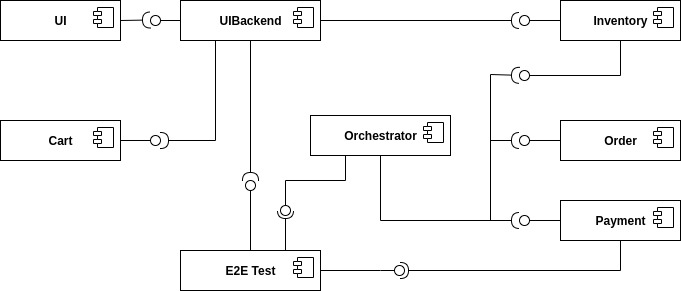
The Test service intercepts request from the UI Backend to the Orchestrator and also snatches the requests from the Payment service to the Credit Institute and answers them in the Credit Institute’s stead. The setup is depicted below. With this setup, the Test service knows the supposed outcome of all requests and can assert that the databases are in the correct state, after a saga instance finished.
For more details, see the Test Service’s README.
Run with script
Start:
./k8s/start-saga-e2e-test.sh
Stop:
./k8s/stop-saga-e2e-test.sh
Step by Step
Run the E2E Test Service
Configure the UI Backend and the Payment Service
Generate load
Look at the logs
Step 1 : Run E2E Test Service
Run the E2E Test Service.
If you are on a Kubernetes cluster, you may apply the deployment from the folder k8s/saga-e2e-test in the devops repository.
kubectl apply -k k8s/saga-e2e-test/
Step 2 : Configure the UI Backend and the Payment Service
Configure the UI Backend such that it sends confirmed orders to the Test service and configure the Payment service to send the payment requests to the Test service.
For Kubernetes
In the UI Backend Deployment (uibackend.yml):
- name: T2_ORCHESTRATOR_URL
  value: http://<e2e-test-host>/test/
In the Payment Deployment (payment.yml):
- name: T2_PAYMENT_PROVIDER_DUMMY_URL
  value: http://<e2e-test-host>/fakepay
In both cases replace <e2e-test-host> with the location of the Test Service.
Or use the deployment in the folder k8s/saga-e2e-test because there the environment variables are already set as described above:
kubectl apply -k k8s/saga-e2e-test/
Step 3 : Generate Load
Refer to the following section for information on how to create a load. There must be some request or else there is nothing to test. The Test service does not generate load by itself.
Step 4 : Look at the Logs
The test results are printed to the logs. This might change but for now it is the easiest solution.
For Kubernetes
kubectl logs <e2etest-pod>
Interpret Output
A test report contains these information:
Expected Saga Status : If it is
FAILUREthen the saga instance supposed to have rolled back, other wise it should have run to completion.Saga Id : Id of the Saga instance in the Saga instance DB. Used to look the Saga instance up.
Correlation Id : Id used by the test service to correlate saga request to the Orchestrator with payment request from the Payment Service.
Order, Inventory, Saga Instance : Displays the test result for the Order and Inventory service and the Saga instance.
Report for rest that found every thing correct:
Test Report:
    Expected Saga Status: FAILURE
    Saga Id: 000001796a7b7be5-7aef648a26a50000 Correlation Id: B42A90324D7639C1BCCC7A5E60080504
     Order: correct
     Inventory: correct
     Saga Instance: correct
Report for test that found that some entries in the inventory database were not deleted correctly:
Test Report:
    Expected Saga Status: SUCCESS
    Saga Id: 000001796a7b7bde-7aef648a26a50000 Correlation Id: A79799BA296DF9035A11D1FF553D1AD2
     Order: correct
     Inventory : reservations for sessionId A79799BA296DF9035A11D1FF553D1AD2 not deleted. ==> expected: <false> but was: <true>
     Saga Instance: correct